Shared Truckload Rate Index
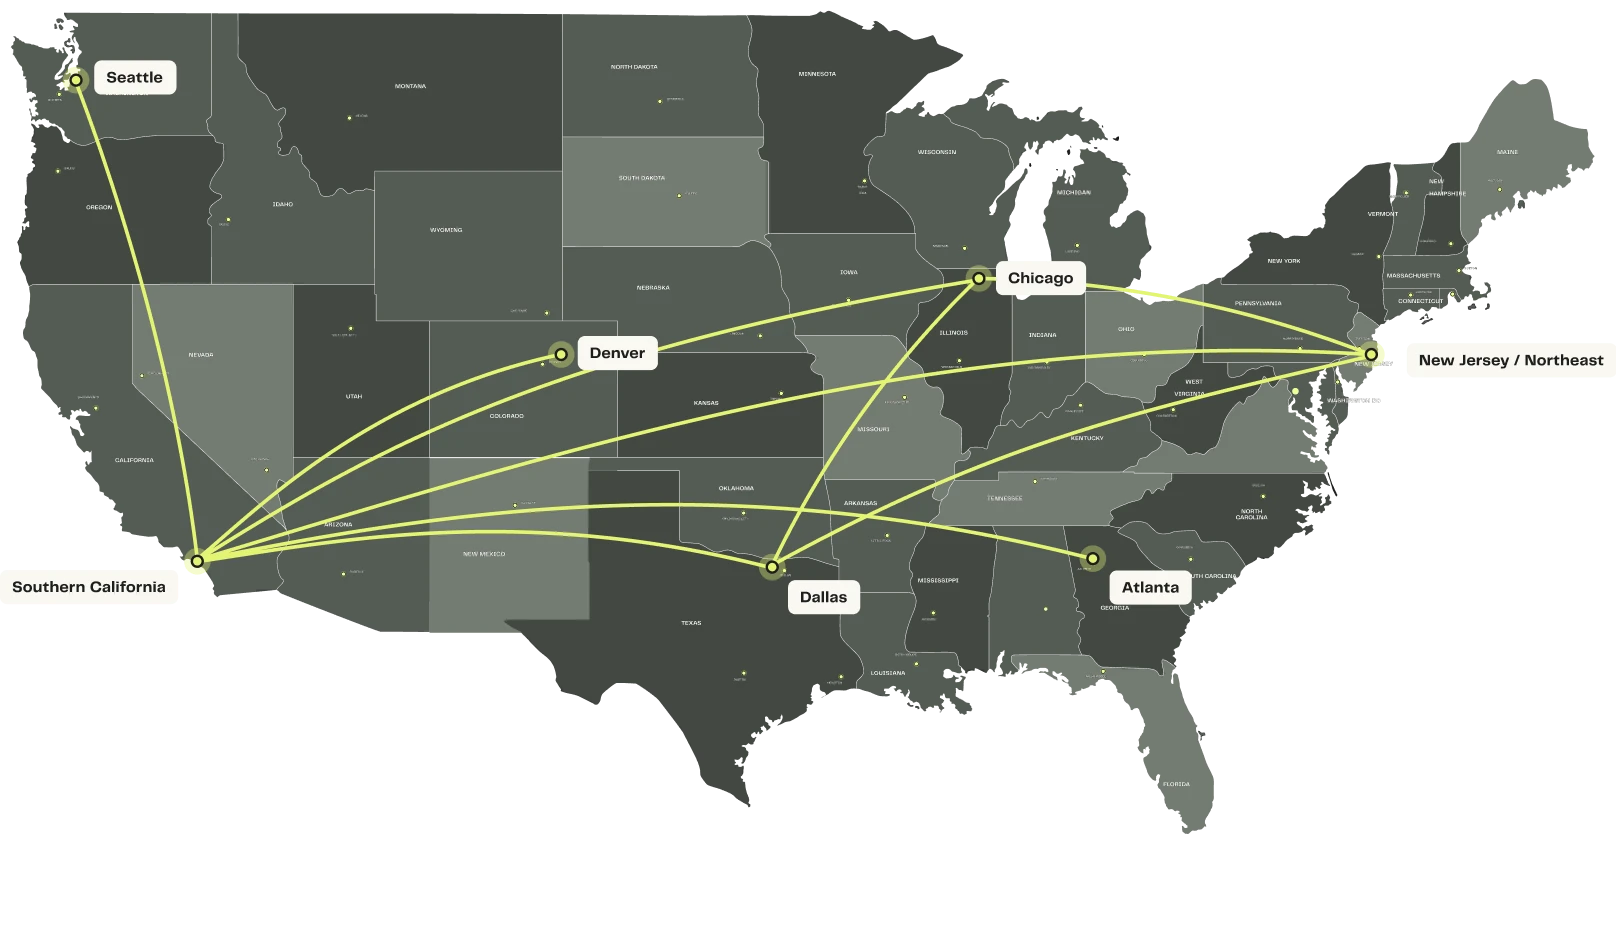
Lane-by-lane view of Shared Truckload savings
Savings are based on the difference between shipping half of a 53' truck through Shared Truckload and booking a full truckload for the same shipment. We use half a truck for illustrative purposes. Your actual savings may vary based on shipment size, lane, timing, and market conditions.
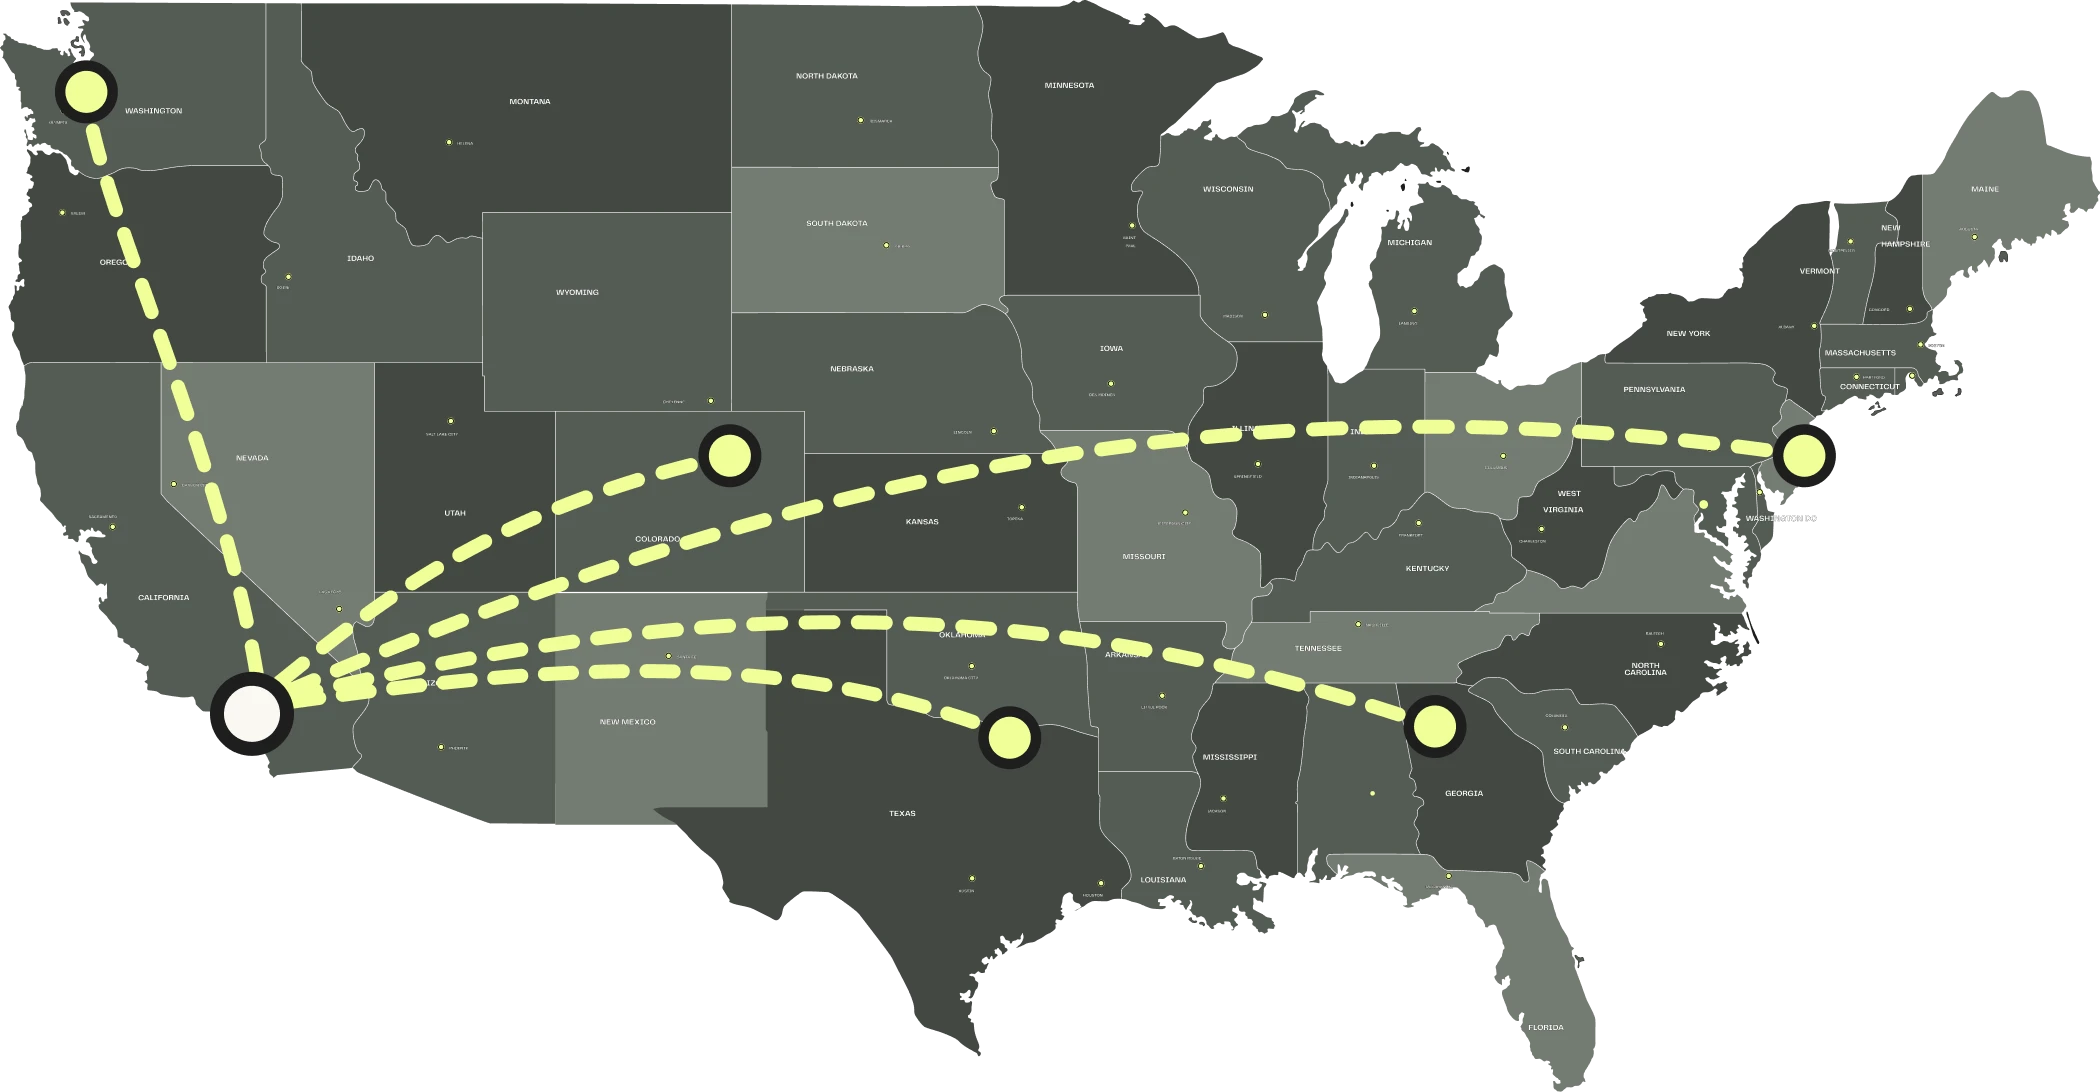
From Southern California
STL savings for half of a truck
to Atlanta
2,145 mi
38% savings
to New Jersey
2,726 mi
42% savings
to Denver
1,024 mi
38% savings
to Seattle
1,151 mi
36% savings
to Dallas
1,411 mi
36% savings
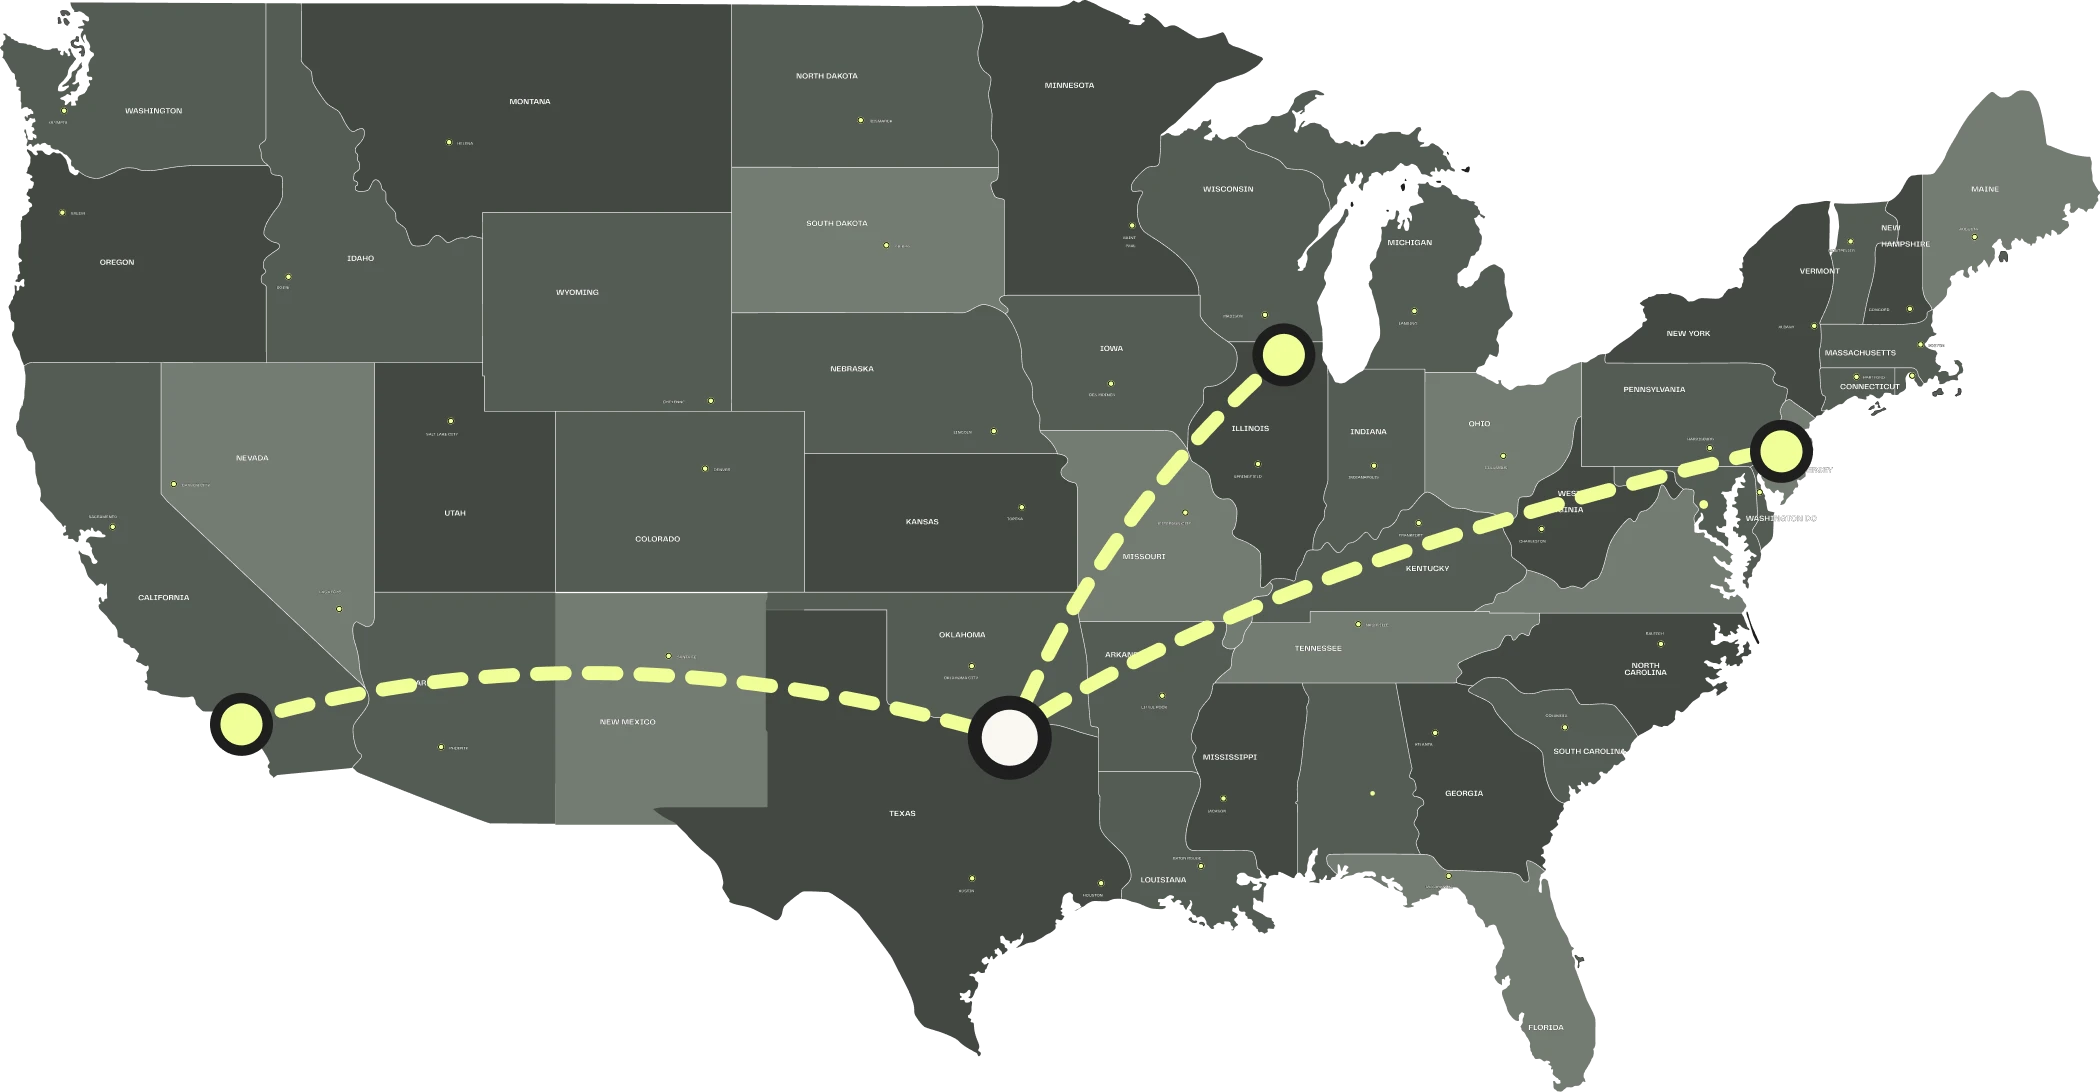
From Dallas
STL savings for half of a truck
to Los Angeles
1,430 mi
28% savings
to Chicago
932 mi
28% savings
to New Jersey
1,537 mi
31% savings
From Chicago
STL savings for half of a truck
to New Jersey
801 mi
29% savings
to Dallas
932 mi
29% savings
to Los Angeles
2,008 mi
31% savings
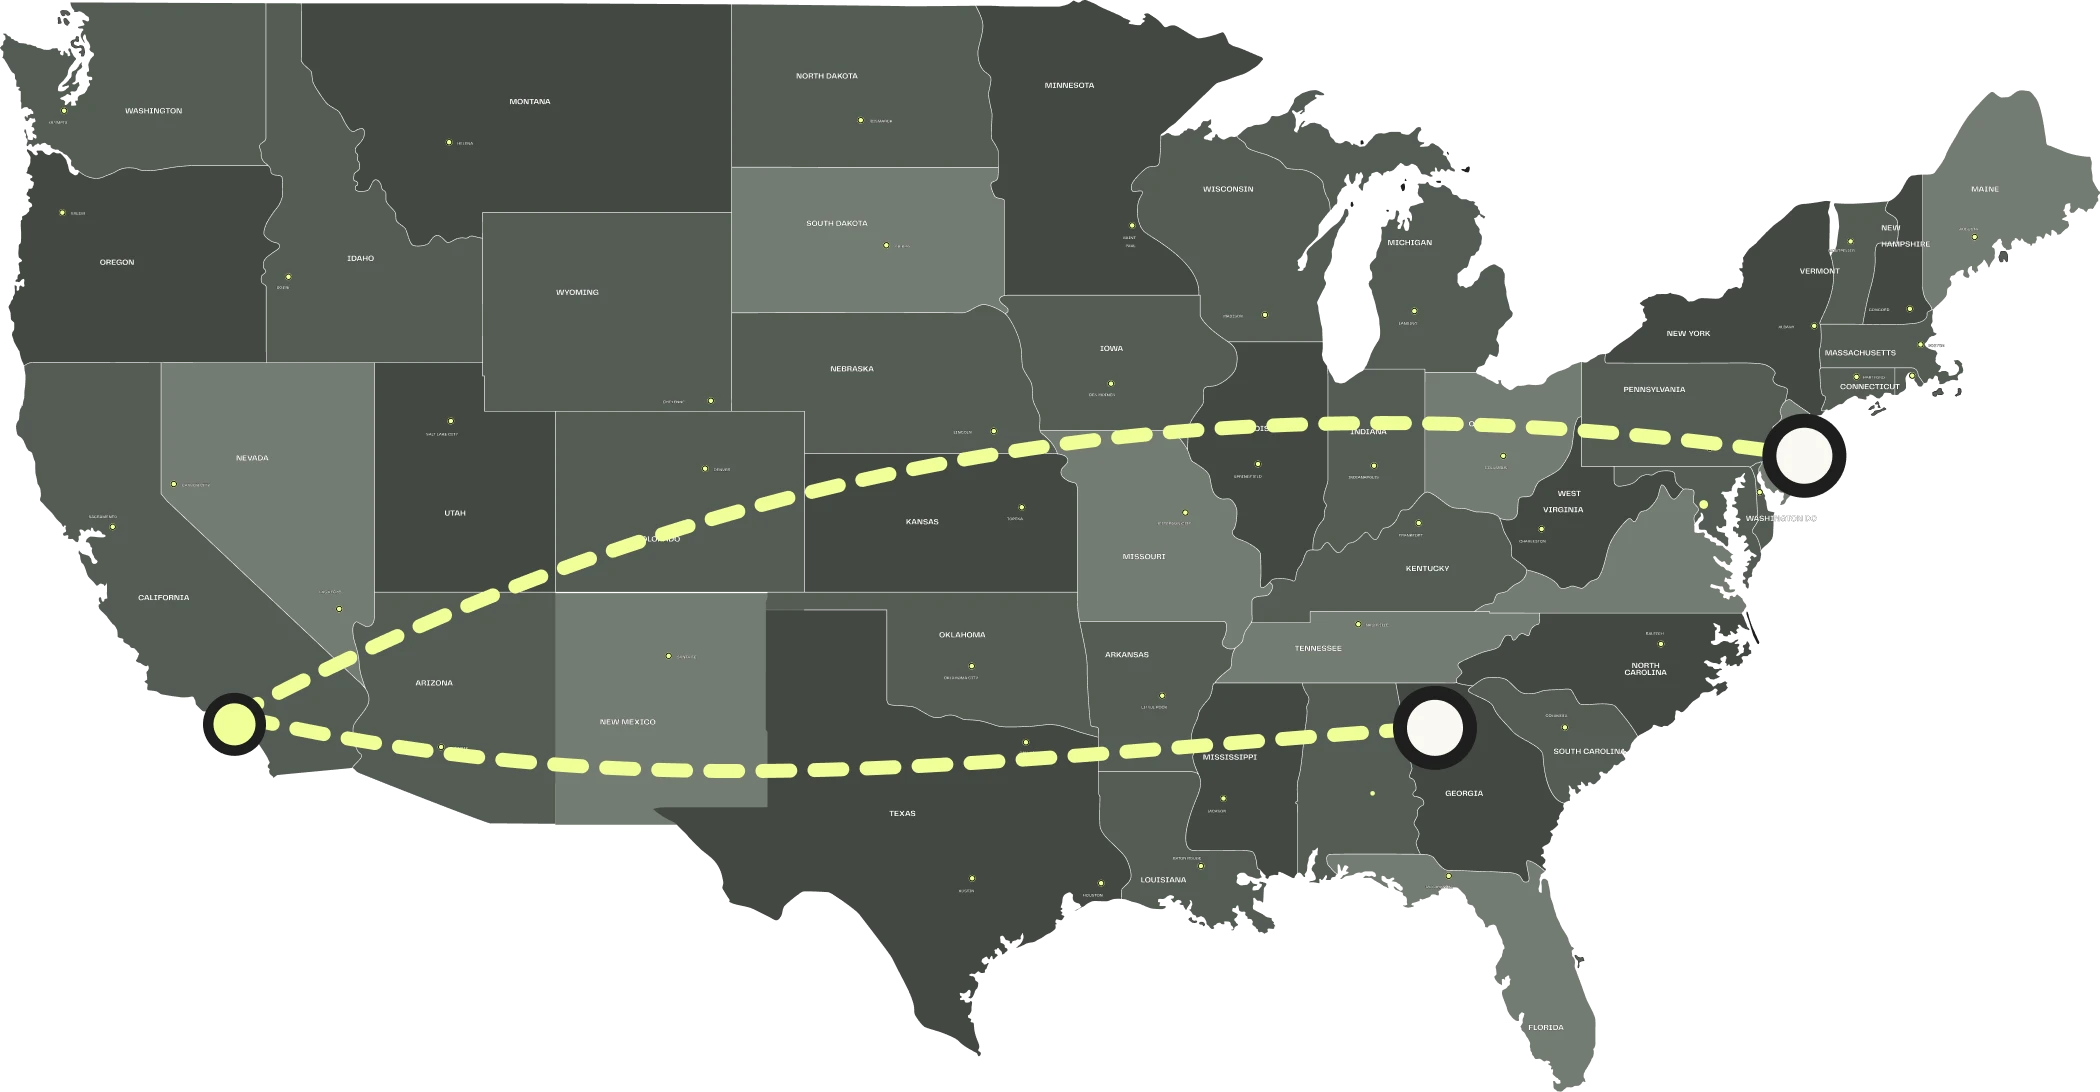
From New Jersey
STL savings for half of a truck
to Southern California
2,731 mi
29% savings
From Atlanta
STL savings for half of a truck
to Los Angeles
2,195 mi
29% savings
STL can reduce freight costs by letting shippers buy only the trailer space they need instead of paying for an underutilized full truckload.
This quarterly updated index highlights selected lanes where Flock is currently driving more Shared Truckload volume and showing strong cost competitiveness versus traditional truckload benchmark rates.
Each lane view compares what a typical shipper might pay today for truckload capacity against what it can cost to buy a half of a truck in a Shared Truckload with Flock Freight. This is not a view of Flock’s entire business or every lane in the market. It is a curated snapshot of representative lanes where Shared Truckload is currently creating meaningful savings opportunities.
You need half a trailer, so why pay for the whole thing?
How to read the STL Rate Index
This report compares Flock’s Shared Truckload pricing with current truckload benchmark rates on a curated set of selected lanes.
To make the comparison intuitive, we priced out the Shared Truckload savings when you buy a half of a truck.
Most shippers ultimately use their own shipment details to get the most accurate price. This index is meant to illustrate directional savings potential on selected lanes, not replace
a lane-specific pricing analysis.
How lane definitions work
We define lanes using broad metro regions and nearby cities that align across major highway flows.
Southern California
Seattle
Dallas
New Jersey
Denver


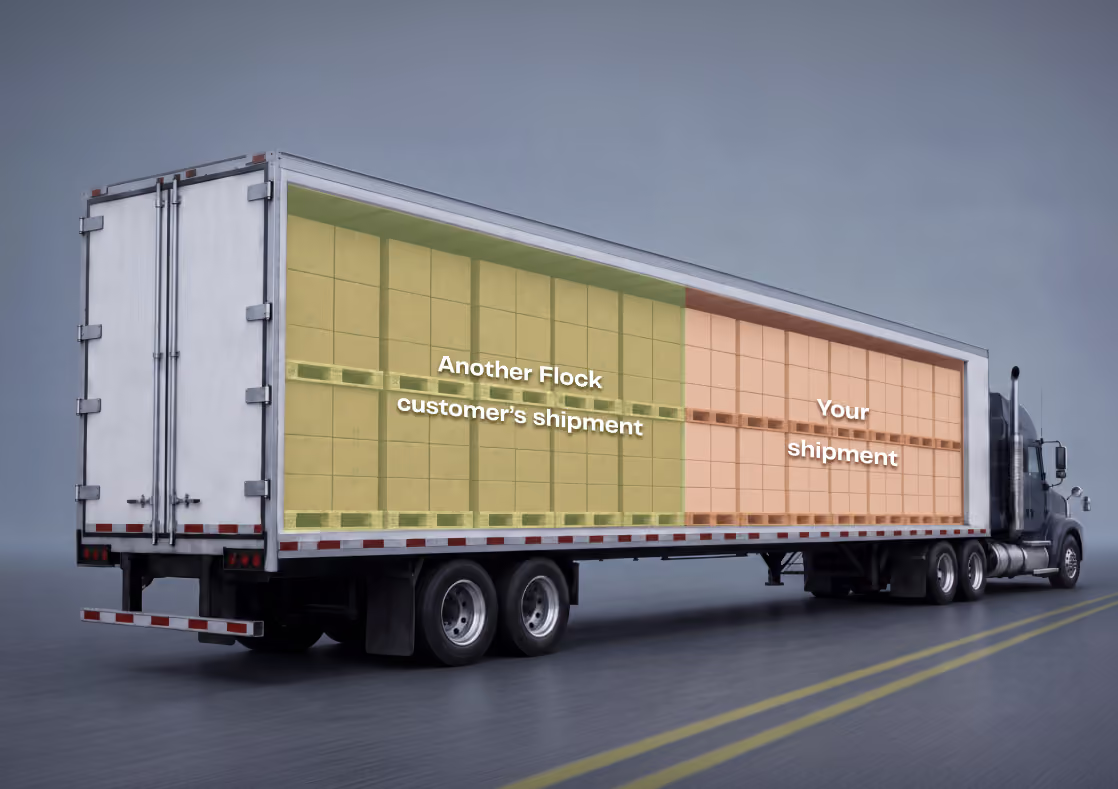
Shared Truckload helps shippers avoid paying for unused trailer space
When a shipper buys a fraction of the truck instead of paying for a full truckload, they avoid paying to move empty space. That is the core reason Shared Truckload can create meaningful cost savings on mid-sized freight.
Why Flock can offer significant savings
- You pay only for the space you need.
- Flock's core AI technology helps identify and build optimized Shared Truckloads at scale.
- As more shipments are added to the network along the same directional flows, Flock can create more efficient pools and pass more value back to shippers.
Savings move with the market
These percentages flex with the market. As the cost of shipping rises, the cost of shipping empty space rises too, which means the savings opportunity from Shared Truckload also grows.





Shared Truckload can create meaningful lane-level savings when a shipper only needs part of the truck
The STL Rate Index is designed to show a simple truth: if a shipment does not need a full trailer, buying a full truckload can mean paying for empty space.
Shared Truckload changes that equation by allowing shippers to buy only the portion of the truck they need while still accessing truckload-level service.
This index is updated quarterly to reflect current lane conditions and benchmark comparisons.

This index highlights selected lanes where Flock is currently driving Shared Truckload volume and cost competitiveness. Rate comparisons reflect a blend of contract and spot pricing, and savings are measured against current DAT truckload benchmark rates with a modest uplift based on the most recently updated refresh date. Lane naming uses broad metro-region definitions rather than exact zip-level origin and destination pairs. These examples are directional and illustrative, and they are not a guarantee of future pricing or savings for any specific shipment.
FAQs
The Shared Truckload Rate Index compares selected STL lane pricing views with current truckload benchmark rates to show directional savings potential.
The index compares Flock Shared Truckload pricing with current DAT truckload benchmark rates with a modest uplift to reflect typical brokerage rates. It shows how the comparison changes when a shipper is buying one-half of a truck in a Shared Truckload.
The index is a curated snapshot of lanes where Flock is currently seeing strong Shared Truckload cost competitiveness. It is not intended to represent every lane in Flock’s network.
Shared Truckload can be cheaper when a shipper does not need a full trailer because it pays only for the space used instead of paying to move empty trailer space.
Yes. When truckload rates rise, the cost of paying for unused space rises too, which increases the potential savings opportunity from Shared Truckload on the right freight.
The index is updated quarterly so the comparisons reflect current lane and market conditions.


